Jimmy Garoppolo's edge on the rookie QBs

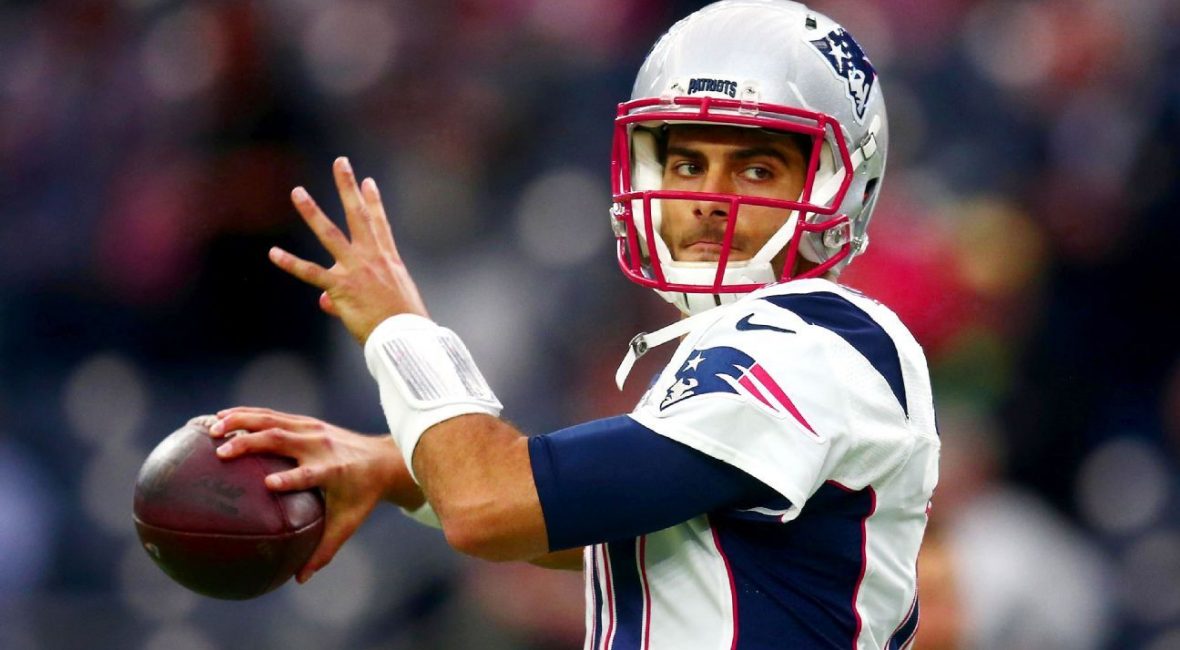
Patriots backup QB Jimmy Garoppolo is the subject of trade speculation thanks in large part to his very strong performance in two starts early in the 2016 season. But how much do just 63 pass attempts tell us about how good a quarterback he’s likely to be?
Garoppolo averaged 7.9 yards per attempt and posted an 88.7 QBR in 2016, both of which are excellent figures. But it’s such a small sample size that it’s unwise to assume he’ll continue at that pace. On the other hand, he did play well for two starts, so his underlying potential is more likely to be good than if he had been mediocre in the same short span. It’s not much, but there is some information to be gleaned.
To quantify just how much weight we should put on that two-game performance, we can use something called Bayes’ theorem, which allows us to systematically update our beliefs as new information arrives. In this case, we can begin with the belief that Garoppolo is drawn from the distribution of QB talent found in the NFL. Then, with every dropback he makes, we can update our belief about where his talent level lies. This approach not only tells us what our best guess of his underlying talent level should be, but also tells us how much uncertainty there should be around that best guess.
Our starting point is the fact that Garoppolo is drawn somewhere from the pool of QB talent typically found in the NFL. Great QBs like his teammate Tom Brady are rare, as are very poor QBs. Although below-average QBs can be found anywhere, they’re weeded out of the league fairly efficiently. So QBs with near league-average talent levels make up the bulk of the population on NFL rosters. Our belief starts with stating that Garoppolo’s true talent level lies somewhere on that spectrum from poor to great, so we can create a probability distribution that best matches the actual distribution of talent. Without knowing anything else about an NFL QB, this distribution captures our prior belief about how good he is.
Then he makes his first throw and we have the tiniest better idea of how good he is. Then, after another throw, we have an ever so slightly better idea of how good he is. We continue to update our belief until after enough dropbacks that we can be confident that he’s actually as good (or bad) as what we’ve seen so far. For a guy like Garoppolo with only 63 attempts over two starts, and a total of 94 attempts through his three seasons, our uncertainty remains very large.
Using just pass attempts from 2016, our updated best guess of his talent level is 7.0 yards per attempt (YPA), which is much closer to league average than his raw average to date. This result underscores the fact that 63 attempts is far too little information to have any confidence in his underlying talent level. In fact, something called a 95 percent confidence interval, which tells us a range of results we can safely bet on, spans from well below average to superstar levels. It would take 500 attempts averaging 7.9 YPA before we could confidently say a QB is above average, and it would take about 1,000 attempts, or about two full seasons, before we realistically could be confident in what kind of talent level a QB has. (Using all 94 of his career attempts yields about the same results.)
Any team considering a trade for Garoppolo should put very little weight in what we saw in 2016.
Of course, for potential bidders like the Bears, Browns and 49ers, the real question isn’t so simple. It’s not a question of Garoppolo or not, but a question of Garoppolo or their next-best option, which is most likely a first-round draft pick such as Mitch Trubisky (North Carolina) or Deshaun Watson (Clemson). And first-round picks carry their own uncertainty. As a group, since 2000, first-round QBs have a career average of 6.8 YPA, with a range of uncertainty even larger than for a player like Garoppolo with 63 throws in two starts.
As little as we know about how good Garoppolo really is, we know even less about a generic first-rounder, plus our best guess at Garoppolo’s underlying talent is slightly higher. With this method, we can even estimate the probability that Garoppolo would be better than the generic first-round QB, given certain assumptions. With what we’ve seen so far, there’s a 59 percent chance Garoppolo would turn out better. If we repeat the same analysis but instead use a more advanced metric of performance — expected points added — we get very similar results: a 64 percent chance that Garoppolo is better than a generic-first rounder.
To get a more intuitive sense of this analysis, the chart below plots our best estimate of a QB who averages 7.9 YPA after a varying number of attempts. The blue line shows that after only a few attempts, our estimate should be close to league average, but as the number of attempts increases, our estimate should approach his actual average. The green line indicates the average YPA for the generic first-round QB, and the red line is the league average overall. The shaded areas depict the uncertainty we should have about where the true average lies. In this case, the mean will be within the shaded area about 67 percent of the time.
For more from ESPN Analytics, visit the ESPN Analytics Index.

